
Core Web Vitals Explained: LCP, CLS and INP
Each metric defined (LCP, CLS, INP — replaced FID in 2024), thresholds for good/needs improvement/poor, how to measure, and the common causes of failures.
Last updated:
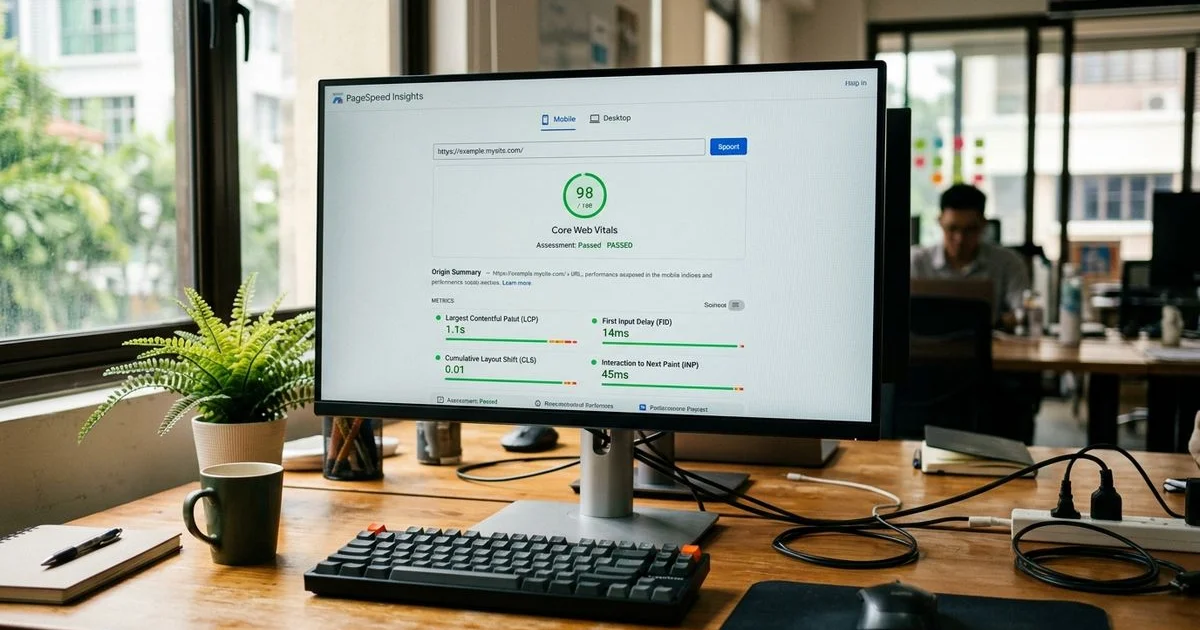
The three metrics that matter
You know how Google’s rules for ranking always seem to be changing? It can feel like a constant battle to keep up.
The good news is that for the past few years, their focus has settled on a stable foundation: user experience. That’s where Core Web Vitals, or CWV, come in. These are three specific, measurable signals that tell Google whether your website feels fast, responsive, and stable to a real person.
They are confirmed ranking factors, especially on mobile, and getting them right puts you ahead of the competition. Studies show that a one-second delay in mobile load times can slash conversions by up to 20%, a massive hit for any business. We build our Our Technical SEO audit process around scoring and fixing these metrics for every part of your site.
Let’s break down the three signals that matter for your page experience and, ultimately, your core web vitals in 2026.
LCP — Largest Contentful Paint
What it measures: LCP is all about perceived loading speed. It marks the point when the largest, most meaningful piece of content, like your main banner image or headline text, becomes visible to the user.
Thresholds:
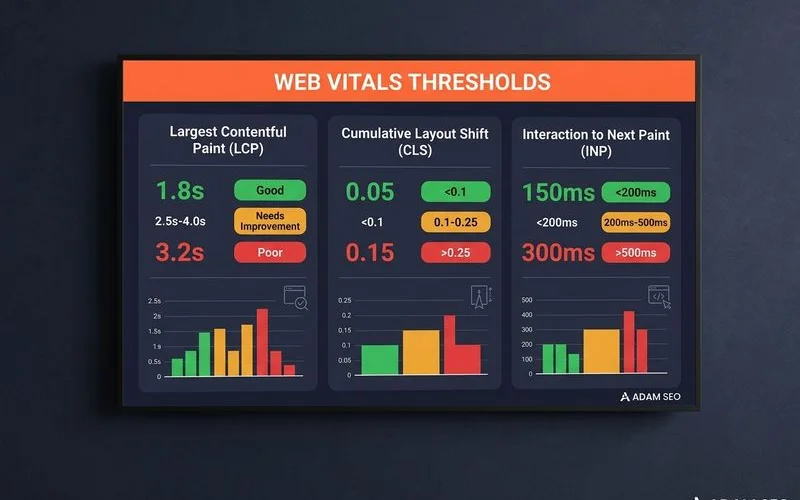
- Good: Under 2.5 seconds
- Needs improvement: 2.5 to 4.0 seconds
- Poor: Over 4.0 seconds
Common causes of poor LCP:
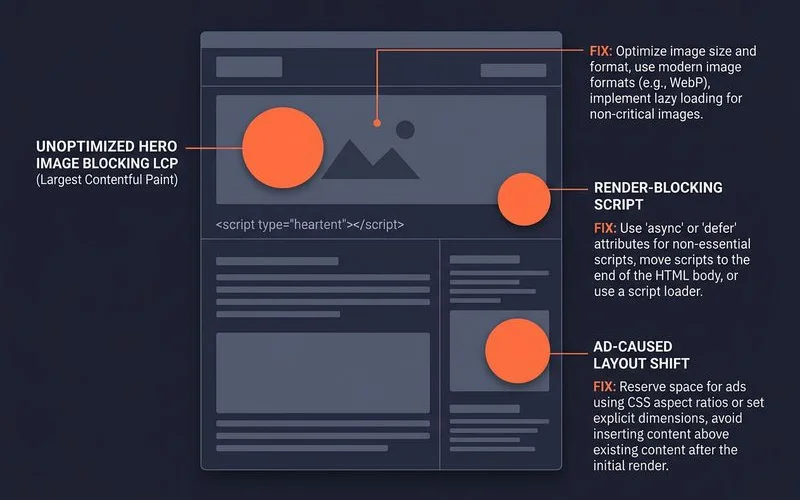
- Unoptimised hero images: This is the most common issue we see. For e-commerce sites, this is often a huge product banner. Using a massive PNG or JPEG file instead of a modern, lightweight format like WebP or AVIF can add seconds to your load time.
- Slow server response time (TTFB): If your server is slow to respond to the initial request, everything else gets delayed.
- Render-blocking JavaScript or CSS: Code that must be loaded and processed before the page can be displayed will stop your main content from appearing.
- Web fonts blocking rendering: If your custom fonts aren’t loaded efficiently, the browser may wait to display text, resulting in a blank space and a delayed LCP.
CLS — Cumulative Layout Shift
What it measures: We’ve all experienced this frustration. You try to tap a button, but just as your finger lands, an ad loads and pushes the button down the page. That jarring movement is a layout shift, and CLS measures the total of all these unexpected shifts.
Thresholds:
- Good: Under 0.1
- Needs improvement: 0.1 to 0.25
- Poor: Over 0.25
Common causes of poor CLS:
- Images and ads without dimensions: If you don’t tell the browser how much space to save for an image or an ad, it won’t reserve the space. When the element finally loads, it pushes all the other content around.
- Late-appearing banners: Cookie consent notices or promotional banners that pop in at the top of the page are a frequent cause of high CLS scores.
- Web fonts causing a swap: When a fallback font is displayed first and then swapped for your custom font, the difference in size can cause text and surrounding elements to reflow.
- Dynamically injected content: Content added to the page with JavaScript after the initial load, without placeholder space, is a common culprit.
INP — Interaction to Next Paint
What it measures: INP measures how quickly your page responds to user interactions. It takes the longest delay between a user’s click, tap, or keypress and the next time the screen updates with visual feedback. This metric replaced First Input Delay (FID) in March 2024 to provide a more complete picture of a page’s responsiveness.
Thresholds:
- Good: Under 200 ms
- Needs improvement: 200 to 500 ms
- Poor: Over 500 ms
Common causes of poor INP:
- Heavy JavaScript tasks: If the browser’s main thread is busy running a complex script, it can’t respond to the user’s input, leading to a noticeable delay.
- Third-party scripts: Chat widgets, analytics, and ad network scripts can all tie up the main thread and block user interactions.
- Complex component updates: On sites built with frameworks like React or Vue, a simple click can trigger a large amount of re-rendering work, which can delay the next visual paint.
- Large DOM size: A page with an excessive number of HTML elements requires more work from the browser to process updates, contributing to slower interaction times.
How to measure
You can’t fix what you can’t measure. Here are four essential tools we use, each with a specific job.
- PageSpeed Insights: This free tool from Google is perfect for quick checks on individual pages. It provides both “lab data” from a simulated test and “field data,” which is real-user data from the Chrome User Experience Report (CrUX).
- Google Search Console: The Core Web Vitals report inside Search Console shows you how your entire site is performing in aggregate. It groups problematic URLs, making it the best place to start for site-wide diagnosis and to prioritise fixes.
- Lighthouse (in Chrome DevTools): This is a developer’s tool for testing in a lab environment before code goes live. We use it during development to catch potential CWV issues before they ever reach your customers.
- Real-User Monitoring (RUM): For the most accurate picture, RUM tools collect performance data from your actual visitors. Tools like Cloudflare RUM, Sematext, or Datadog show you how your site performs in the real world, which is crucial for Malaysian sites.
Field data from the Chrome User Experience Report (CrUX) is especially important here. It reflects the reality of Malaysia’s varied internet speeds. According to Ookla’s data from April 2026, the median mobile download speed in Malaysia is 154.13 Mbps, which means many users are on connections that are less forgiving than a developer’s high-speed office connection.
Common causes diagnosed in our audits
During our technical SEO audits, the same handful of issues appear again and again. The good news is that they are all fixable.
Hero image not optimised
We frequently see massive PNG or JPEG files where a modern format would be far better. For static images, AVIF often provides 20-30% better compression than WebP, though WebP is faster to create on-the-fly and has slightly wider support. The fix involves converting the image to the best format, using srcset for different screen sizes, and adding loading="eager" and fetchpriority="high" hints to tell the browser to load it first. This change alone can often improve LCP by 1-2 seconds.
Web fonts blocking render
Custom fonts that are loaded without the font-display: swap CSS property make text invisible until the font file has fully downloaded. Our solution is to add this property, which tells the browser to show a system font immediately and then swap it once the custom font is ready. We also preload the most critical font files to speed up the process.
Synchronous third-party scripts
Many analytics tools, marketing pixels, or chat widgets load synchronously by default. This means they block the main browser thread from doing anything else until they are finished. We fix this by ensuring they are loaded asynchronously or deferred until after the main content is rendered, often by managing them through Google Tag Manager with carefully configured triggers.
Layout shifts from late-injecting elements
This is a classic problem. A cookie consent banner, a special offer notification, or an ad slot appears after the page has started to render, pushing everything down. The fix is to pre-allocate the required space using CSS, often with properties like min-height or aspect-ratio, so that the page layout is stable from the start.
React/Vue hydration costs
For sites built on modern JavaScript frameworks, the initial page load can involve a lot of client-side rendering work. This can block user interactions and hurt INP. The solution is often to use a framework like Next.js or Nuxt.js to perform server-side rendering (SSR), which delivers a fully formed HTML page to the browser. For highly interactive sections, we can use partial hydration techniques, sometimes called an islands architecture, to reduce the amount of initial JavaScript.
What we ship in a Core Web Vitals fix
Our process is structured and transparent.
In the first month, we conduct a full Core Web Vitals audit across every page template on your site. This results in a prioritised list of fixes, ranked by the impact they will have on your scores and user experience.
During months two and three, our development team ships the high-impact fixes. This typically includes comprehensive image optimisation, streamlining font delivery, and re-configuring how scripts are loaded to prevent render-blocking.
From month four onwards, we move to a phase of ongoing monitoring and iteration. As new code is shipped to your site, we keep a close watch on the CWV scores to ensure performance doesn’t degrade.
Most sites we work with move from “poor” or “needs improvement” to “good” on at least two of the three metrics within the first 90 days. The final metric, which often requires deeper framework-level changes, typically reaches the “good” threshold within six months.
Want a CWV audit run on your site? Request a discovery call.
Quick Answers
Does failing Core Web Vitals hurt rankings?
How quickly can I fix poor LCP?
Should I optimise for mobile or desktop Core Web Vitals first?
Related Guides
JavaScript SEO and Crawl Budget — Diagnosing Index Issues
How Googlebot renders JavaScript, when client-side rendering breaks SEO, SSR vs SSG trade-offs, diagnosing crawl-budget waste, and the 'Crawled — currently not indexed' pattern.
Technical SEO Audit Checklist for Malaysian Websites
Crawl, index, Core Web Vitals, mobile, hreflang for bilingual EN/BM sites — the full Stage 1 audit checklist Adam SEO runs on every new client.
Ready for the service?
Learn more about Technical SEO Audits
Stage 1 deep-dive audits covering crawl, indexation, Core Web Vitals, schema, and JavaScript rendering — the foundation that every other SEO investment sits on.
Explore the Technical SEO Service