
What SEO ROI Should You Realistically Expect?
How SEO ROI is calculated, realistic break-even timelines per retainer tier, and what an Adam SEO 283%-revenue case study actually looked like month-by-month.
Last updated:

You know how the toughest part of any SEO campaign isn’t the technical work, but explaining the value to your leadership team? It’s a conversation every marketer in Malaysia has had.
You are trying to justify a multi-month investment while the numbers on a spreadsheet look flat for the first quarter.
Since our founding in 2011 by SEO veteran Adam Yong, we have seen this scenario play out dozens of time. The key is to shift the conversation from cost to a clear, data-driven forecast of return. It is not about faith, it is about maths.
Here, we will break down exactly how to calculate and project your SEO return on investment in the Malaysian market. We will look at the real formula, what break-even timelines look like, and how to frame the investment for your CFO.
How SEO ROI is actually calculated
The formula for SEO return on investment is simple, but the variables require honest tracking.
SEO ROI = (Incremental organic revenue - Retainer cost) / Retainer cost
Where:
- Incremental organic revenue = (additional monthly organic traffic × visitor-to-lead conversion rate × close rate × average deal value)
- Retainer cost = monthly retainer × number of months in the period
The maths is straightforward. The challenge lies in accurately tracking the “incremental” revenue. To do this properly, you need reliable benchmarks for the conversion steps. For many Malaysian B2B businesses, a visitor-to-lead conversion rate typically falls between 1.8% and 3.0%. From there, a strong sales process can often convert 20% to 30% of those qualified leads into customers.
Driving 1,000 extra visitors is only valuable if they convert. That is why accurate tracking, often connecting Google Analytics with a CRM like HubSpot, is critical to prove the return. Our 4-Stage Framework covers the methodology for improving the conversion side of this equation, because traffic without revenue is just a vanity metric.
What break-even looks like by tier
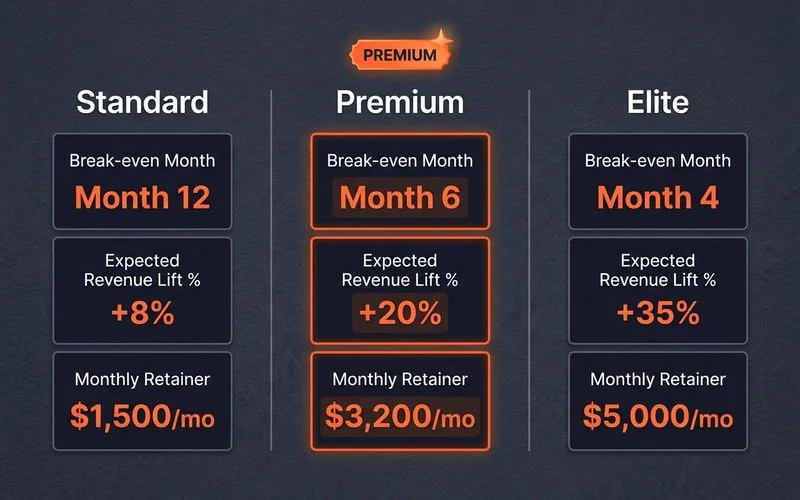
Three different starting points produce three different break-even curves, reflecting the competitive reality of the Malaysian market. The monthly retainers here are consistent with average local agency pricing.
| Tier | Monthly retainer | Typical month-by-month break-even | Cumulative break-even |
|---|---|---|---|
| Standard | RM 2,500 | Month 6-8 | Month 10-12 |
| Premium | RM 4,500 | Month 7-9 | Month 11-14 |
| Elite | RM 9,500 | Month 8-10 | Month 12-16 |
Higher tiers take a bit longer to break even because the initial investment is larger. However, they are designed for more competitive industries and typically generate 2-3x the revenue uplift by the 24-month mark. The right tier depends on factors like your industry’s keyword competition and your current revenue. Our pricing guide covers how to select the right tier for your business in detail.
The case study month by month
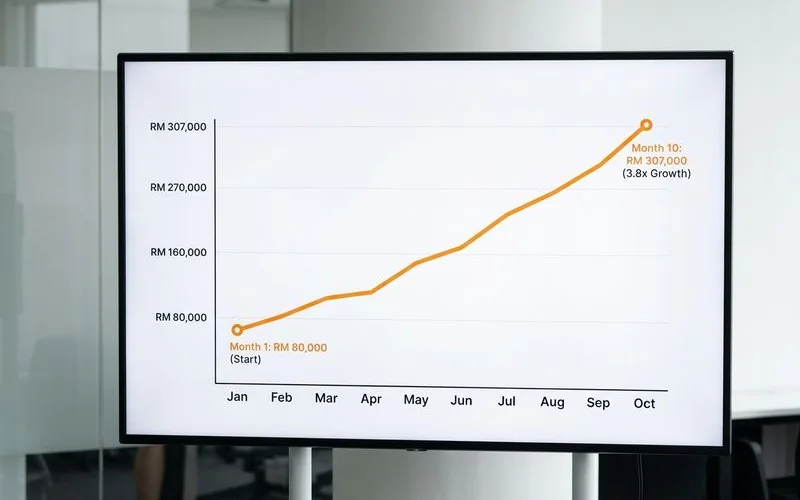
We can share the real numbers from one of our most public engagements. The client started at RM 80K in monthly revenue and grew to RM 307K by the tenth month. Here is how that growth actually happened.
Months 1-2
Revenue remained flat at around RM 80-85K. During this phase, we conducted a full Stage 1 audit. The focus was on fixing technical issues left by previous agencies, especially around schema markup and Core Web Vitals. This meant optimising for metrics like Largest Contentful Paint (LCP) to get it below the 2.5-second threshold, a common challenge for Malaysian websites.
Months 3-4
Revenue increased to RM 110-130K, a lift of 38-63%. The Stage 2 Conversion Rate Optimisation (CRO) changes began converting existing traffic more effectively. At the same time, the first batch of rewritten product pages started gaining higher rankings.
Months 5-7
The growth continued, with revenue climbing to RM 180-230K (+125-187%). Rich results driven by correct schema implementation, like product ratings appearing in search results, significantly boosted click-through rates. The content velocity from Stage 3 began to compound, and a restructured internal linking strategy directed more authority to the most profitable product pages.
Months 8-10
Revenue hit a new high of RM 280-307K, a total increase of 250-283%. With substantial traffic from Stage 3, we layered on Stage 4 remarketing. This caused the cost-per-acquisition to drop sharply, allowing for a proportional reduction in ad spend.
What an underperforming month looks like
Not every month shows growth. An effective SEO engagement will have flat or slightly down months. The important questions are about the reasons why and the plan for what comes next.
Healthy underperformance
This can be caused by external factors. A major Google core algorithm update, for instance, can cause temporary ranking shifts across an entire industry. Other causes include a planned site migration that momentarily reduces traffic or a predictable seasonal dip in your business category.
Unhealthy underperformance
This points to issues with the strategy. Red flags include three or more straight months of flat traffic with no clear explanation in your report. Be wary of reports that only mention content delivery but never connect it to revenue. If you ask “what will be different next month” and get vague answers, it is time for a serious conversation.
If you find yourself in the second category, a recalibration is needed. It may not mean you have to switch agencies, but it is definitely a discussion worth having.
Setting expectations with leadership
The most difficult part of an SEO investment is often internal. Selling a 12-month timeline to a board or CFO accustomed to the immediate feedback of ad spend requires framing the conversation correctly.
Frame SEO as building an asset, not buying traffic
Every month of investment compounds. Unlike paid ads, where the traffic stops when you stop paying, SEO builds a lasting asset. By month 12, that asset is generating revenue at a marginal cost that paid acquisition simply cannot match. Users also tend to trust organic results far more than paid ads.
Show the 24-month cumulative chart, not the month-1 line
On a single-month chart, the initial ROI for SEO can look poor. On a 24-month cumulative chart, it almost always looks excellent. We use tools like Looker Studio to create these visualisations. The framing you choose completely changes the conversation from an expense to a long-term, high-return investment.
Want a custom ROI forecast for your business? Request a discovery call. We will project the break-even curve based on your category, current revenue, and chosen tier.
Quick Answers
Is the 283% revenue case typical?
How do you calculate ROI when our deal cycle is 6+ months?
What's an acceptable break-even timeline?
Related Guides
The Adam SEO 4-Stage 9-Step SEO Framework Explained
Inside the Adam SEO methodology: 4 stages (Analysis, CRO, Optimization, Re-Engagement) and the 9 specific steps that turn organic traffic into revenue.
Common SEO Myths and Misconceptions (Debunked for 2026)
Myth-busting on guaranteed rankings, link buying, keyword stuffing, 'SEO is dead' claims, and AI replacing SEO. What actually moves the needle in 2026.
How Long Does SEO Take to Show Results in Malaysia?
Realistic SEO timeline: technical quick wins in month 1, ranking movement by months 3-4, meaningful revenue impact by months 4-8 for Malaysian businesses.
How to Choose an SEO Agency in Malaysia (2026 Buyer's Guide)
What to look for in a Malaysian SEO agency: red flags, the right questions to ask in discovery, and reporting standards that separate operators from sellers.